Cotton yarn export slump continues in May, deteriorates further
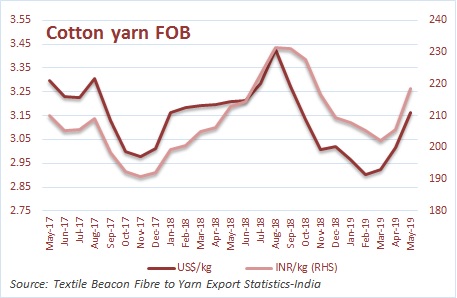
The slump in cotton yarn export from India continued after ending fiscal 2018-19 with a yearly high in March. In April, export in US$ terms fell 14% with volumes down 8.5%. Offer price averaged INR206 per kg. In May, cotton yarn export was at 77 million kg worth US$243 million (INR1,676 crore), down 30% from a year ago level in US$ terms. Shipment volume was down 29% but average price rose to INR219 a kg.
During May, 73 countries imported cotton yarn from India at an average price of US$3.16 a kg, up US cents 14 from previous month but down US cents 5 from last year.

China, the top cotton yarn market, imported 60% lesser cotton yarn from India this May. During the month, export to China was 21 million kg worth US$55 million only. China was followed by Bangladesh with volume and value declining 28% year on year. Portugal and Egypt were the other major importers of cotton yarn, with former recording 17% increase and latter falling 12%.
Sixteen countries did not import any cotton yarn from India this May as they had imported yarn worth US$2.10 million in May 2018. However, they were replaced by 12 other countries which imported yarn worth just US$0.44 million.
Russia, Nepal, Netherlands and Iran were among top fastest importers in May while Brazil and Belgium significantly reduced their imports compared to last year.
About 69% were combed yarn which fetched an average price of US$3.36 a kg while carded yarn fetched US$2.83 a kg. OEs were exported at US$1.81 a kg.
Grey cotton yarn accounted for 94% of all cotton yarn exported in May. However, they were down 28% both in terms of volume and value compared to May 2018.
30/1, 40/1, 20/1, 32/1 and 26/1 were the top five counts exported this May. The respective average price realization was US$3.11 a kg, US$3.49 a kg, US$2.82 a kg, US$3.06 a kg and US$3.03 a kg. These were US cents 7-14 lower than in the same month of 2018.
For 30s, Egypt, Peru, Bangladesh, Iran and China were the top five markets while 40s were exported mainly to Bangladesh followed at a distance by China.