Textiles production recovers in June, but data apparently unreliable
Index of Industrial production released by the government last weekend shows that textiles production has recovered in June after 13 months of consistent year on year decline. The general index has increased 7% with manufacturing sector expanding 6.9%. Mining activity was up 6.6%, while electricity sector rose 8.5% during the month.
National dailies carried headlines after the data release on 10 August, two days ahead of its normal date. They were like;
- IIP surges to five-month high of 7% – The Hindu
- Factories grow at fastest pace in 5 months on lower base – Livemint
- IIP rises to four-month high of 7% in June – Economic Times
- IIP zooms to 7%, may push April-June quarter GDP to 7.5% – The Hindu BusinessLine
However, the fact remains is that how reliable is this data released by the government. Many sectors have not even recovered from previous year’s fall and those show any rise last year are down this year. Sectoral growth movements do not corroborate with the usual trend or ground reality. For example;
Beverage production grew 10.5%, the fastest of this summer season, but coming at the end of the season and rains enter the country. Beverage consumption starts declining during this period.
Production of petroleum products increased 12%, with the previous growth closer to it was in January 2018 (11.5%) and from a high 15% clocked in October 2016. This has come when petroleum prices hitting new peaks every day. Does it mean that petroleum production demand is inelastic?
Manufacture of fabricated metal products, except machinery and equipment was up 11.9% and averaging 11.5% when basic metal production growth averaged 3.9% in past three months. Stainless steel utensils production more than doubled in June, a case to study the consumer buying pattern during this period to validate such a growth.
Manufacture of computer, electronic and optical products jumped 44% in June, again a case to study buying pattern of gadgets. The industry has been clocking high growth rates in the past 12 months, averaging 25% for a month.
Textiles production
Coming to textiles, the IIP for textile was up 2.1% during June, driven by the 4.4% increase in manufacture of wearing apparel. Meanwhile, manufacture of textiles (basis goods like yarn, fabric) declined 0.8% over and above the fall of 3% clocked in June 2017. This implies that, basic textiles production is yet to reach a month level of June 2016. This raises a moot question, how can wearing apparel output grow, when production basic inputs are falling. The answer could be imports for sure.
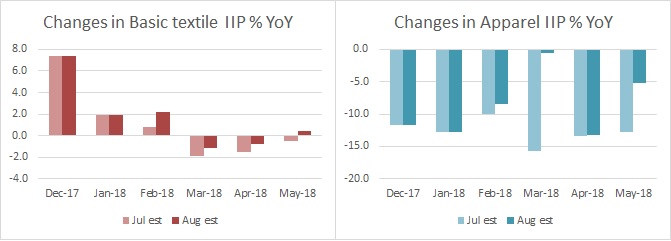
What is more disturbing is the revisions in IIP estimates, which not only change the proportion but also the course. This may be due to updation and revision in data from original sources. This is comparing data CSO release of July with data up to May and release of August with data for June. In July estimates, manufacture of textiles had declined 0.5% year on year in May 2018, and the revised data of August shows it has increased 0.4%. This has changed the course of the industry. Similarly, IIP estimates have undergone revision from February to May 2018 in the August release. Manufacture of wearing apparels, which had shown decline of 13% in July estimates for May, is now down by just 5.2%. Thus, the overall textiles production for May showed a decline of 8.9% while the revision pegs it at a slower fall of just 3.9%.

Such variations in basic official information raises a question on the reliability of data upon which policies are framed. This can only be misleading and get dirtier results.